Introduction to Triaging Fuzzer-Generated Crashes
Intro
With the rise of well-documented, user-friendly fuzzers such as AFL, fuzzing has become a more approachable discipline. It’s possible for someone with no prior fuzzing experience to get up and running with AFL within a few hours or less. However, while the initial fuzzing process has become less intimidating, the next steps may remain a mystery for newcomers.
One particularly recondite phase in the fuzzing lifecycle is crash triage. I imagine that many other beginners in the realm of fuzzing share my experience of letting a fuzzer run, returning to find an output directory brimming with crashes, and wondering “Okay, so now what?”
Crash triage involves examining each crash discovered by a fuzzer to determine whether the crash might be worth investigating further (for security researchers, this typically means determining whether the crash is likely due to a vulnerability) and, if so, what the root cause of the crash is. Reviewing each crash in detail can be very time consuming, especially if the fuzzer has identified dozens or hundreds of crashes.
This blog post will provide a gentle introduction to some techniques and tools you can leverage to guide your triage process. While crash triage will still likely be a slow process, the tools described in the following sections can help alleviate some of the tedium and aid you in prioritizing and analyzing the crashes that are most likely to reveal security-related issues.
Assumptions and setup
For the purposes of this post, I’ll assume that the end goal of the fuzzing lifecycle is to identify security vulnerabilities that could be leveraged in creating an exploit for the targeted software. I’ll also assume that readers are using AFL as their fuzzer, since it’s a very popular and user-friendly fuzzer with a proven track record of discovering security-related issues. Some of the tools detailed in this post are not AFL-specific, however, and could be applied to crashes produced by any fuzzer.
This post doesn’t cover other fuzzing phases, so I won’t spend time showing how to instrument a binary with AFL or begin fuzzing. You can obtain the source for the binaries I used from the links below.
https://github.com/mykter/afl-training/tree/master/quickstart
https://github.com/fuzzstati0n/fuzzgoat
Additionally, I’m using the GEF plugin for GDB, which you can obtain here:
Basics of reproducing a crash and initial analysis
Let’s assume we’ve just finished running AFL against our target binary and have some crashes in our output directory.

In this case, we have six unique crashes, plus an auto-generated README.txt file that contains some information about our fuzzing session. This is a pretty manageable number of crashes, mostly because I fuzzed a very small sample binary. However, it’s very easy to imagine this number being much higher after fuzzing some more complex software. As you’ll see, even a small number of crashes would be tedious to triage purely by hand.
First, let’s make sure we can reproduce one of these crashes by opening the fuzzed binary again in GDB and piping the crash file as input to the run command (the vulnerable binary expects input from stdin).

This successfully reproduces the crash, as seen in the following screenshot:
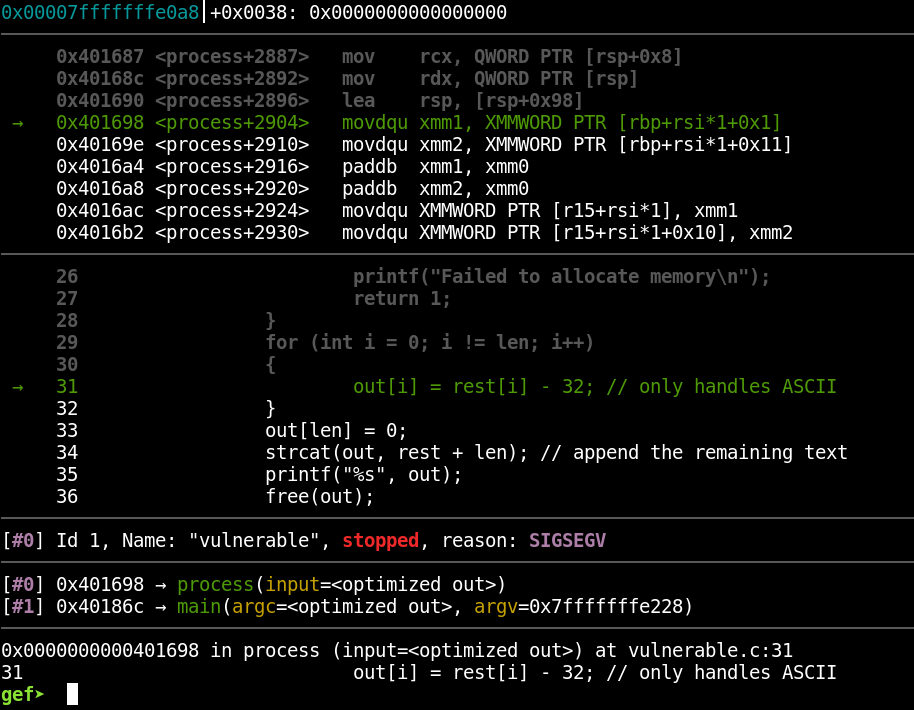
Notice some useful information we have:
- The signal (in this case a SIGSEV)
- The source line on which the crash occurs (we have access to this because the binary was compiled with debugging information)
- The line of disassembly on which the crash occurs
- The backtrace (the series of functions that were called to arrive at the current, crashing function)
- Other typical debugger output
This is important information, and after narrowing down the list of crashes to only the most promising ones (i.e. the ones most likely to be related to vulnerabilities), you can expect to spend a lot of time working through the crashes in a debugger. However, going through every crash this way, one by one, would be tedious and potentially extremely time consuming, depending on how many crashes the fuzzer has generated. Let’s examine some tools that can simplify this process and provide useful insights when searching for vulnerabilities.
GDB exploitable plugin
https://github.com/jfoote/exploitable
This is a plugin for GDB that attempts to determine whether a particular crash is likely to be exploitable. The tool provides a series of classifications for various application states. If the application is in a state that the tool recognizes, it’ll assign the state an exploitability classification.
The value of this tool is that it can help users prioritize analysis of the crashes that are most likely to be exploitable. Crashes that are unlikely to be exploitable (or cause states that the exploitable plugin can’t assess) may still be worth examining, but only after the more promising crashes have been analyzed. Exploitable is an excellent tool for directing one’s attention to where it’s probably needed most.
Upon installing the extension, usage is very simple. If we return to the crash we reproduced above in GDB, we can use the plugin to assess the current application state’s exploitability by simply typing “exploitable”:

In this case, the exploitable plugin is only aware of the general cause of the crash and can’t assess the exploitability of the crash condition. Let’s examine the next crash in our list (also due to a SIGSEV) and see if the plugin fares better with it:

This time, the plugin classified the crash as “EXPLOITABLE” and provided a brief explanation of the crash condition. As far as I’m aware, the exploitable plugin doesn’t take into account factors such as the need to bypass exploit mitigations in use or the overall usefulness of an exploitable issue. However, an “EXPLOITABLE” classification is a good indicator that this bug provides a potentially useful exploit primitive to leverage. The plugin’s description and explanation also help users quickly ascertain what the general bug class probably is. The plugin’s analysis for some of the other crashes can be seen below:


Crashwalk
https://github.com/bnagy/crashwalk
Crashwalk is a nice complement to the exploitable plugin detailed above. Crashwalk will iterate through crashes generated by AFL and run exploitable on the crash state. It’ll ultimately create a crashwalk.db file that contains the output from exploitable. It’s also capable of organizing its output further, but for introductory purposes, it’s good enough to think of it as a tool that automates the process of viewing each crash in GDB, running the exploitable plugin, and capturing its output.
Crashwalk seems to have issues reproducing crashes on programs that read purely from stdin instead of from a file, so for this example, I’ll show using crashwalk on the fuzzgoat program. Crashwalk’s triage component can be run with the following commands:
|
1 |
export CW_EXPLOITABLE=/home/reverse/tools/exploitable/exploitable/exploitable.py |
|
1 |
./cwtriage -root ~/fuzzing_examples/fuzzgoat/out/crashes -match id -- ~/fuzzing_examples/fuzzgoat/fuzzgoat @@ |
Because cwtriage makes use of exploitable, it needs to know the path to exploitable‘s source file. This path can be specified with the CW_EXPLOITABLE environment variable. The “-match” argument provides a regular expression to use to identify the crash files. Since all the AFL crash files begin with “id”, that’s the parameter we’ll provide. The “@@” symbol indicates where the crash file should be sent as an argument to the binary.
Upon running the above commands, you should see cwtriage tool iterate through each crash file and display the output from exploitable.
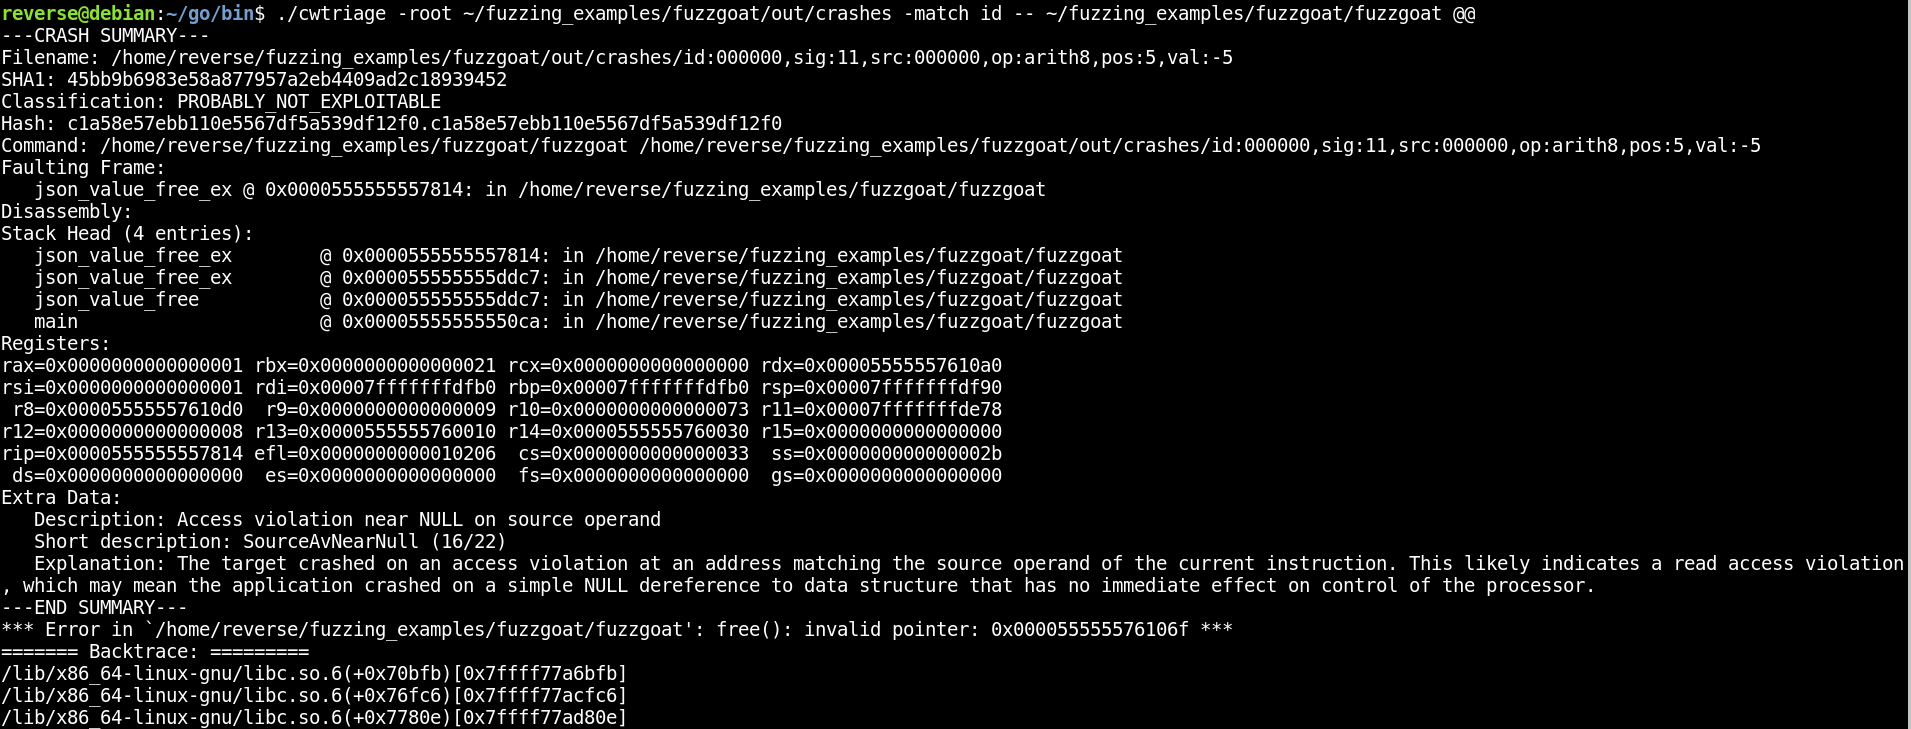
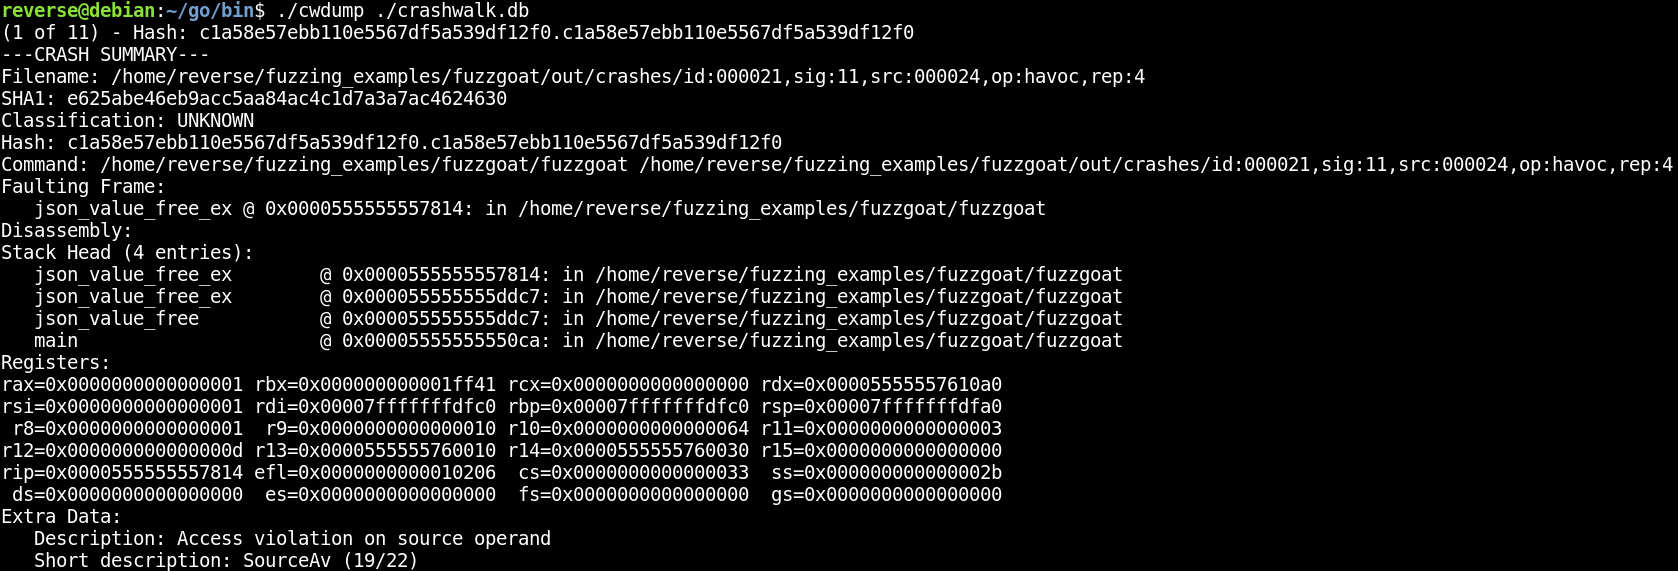
You can examine this output and take note of the crashes that have been classified as likely to be exploitable. cwtriage will also create a file called “crashwalk.db”. You can use the “cwdump” component of crashwalk to get a summary of the crashes with the following command:
|
1 |
./cwdump ./crashwalk.db |
AFL crash exploration mode
https://github.com/google/AFL#10-crash-triage
This is a mode built into AFL that will take a known crash and iterate on it to find other variations of the same crash. In this mode, AFL will identify changes that can be applied to the crash-generating input in order to reach other code paths without resulting in a different crash.
Typically, you want your fuzzer to find lots of unique crashes, not the same crash over and over. However, as noted in AFL’s README, the point of this mode is to create “…a small corpus of files that can be very rapidly examined to see what degree of control the attacker has over the faulting address, or whether it is possible to get past an initial out-of-bounds read – and see what lies beneath.”
In other words, seeing lots of variations of one crash can help give you an idea of how much flexibility the crash affords you — for example, if the crash is related to writing to an address, but you have no control over that address, that may not be a particularly useful primitive. On the other hand, if AFL’s crash exploration mode determines that you can change the input to cause the write to be performed to an arbitrary address, you’re much more likely to be able to leverage the bug in an exploit.
You can find more details about this mode here:
https://lcamtuf.blogspot.com/2014/11/afl-fuzz-crash-exploration-mode.html
As an example, let’s take a set of initial crashes we’ve already generated with AFL and try using AFL’s crash exploration mode on them. We’ll use this syntax (note the use of -C to enable crash exploration):
|
1 |
../tools/AFL/afl-fuzz -C -i out/crashes/ -o crash_exploration/ ./vulnerable |
Any new crashes based on the exploration of the existing ones will be output to the crash_exploration/ directory.
When AFL begins to run in this mode, it’ll check the test cases to make sure they each result in a crash, as seen in the following screenshot:
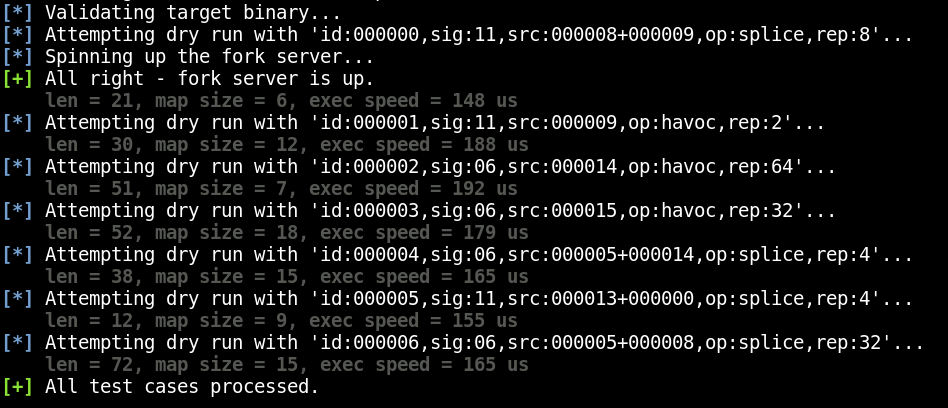
In a normal run of AFL, the purpose of this step is to sanity check the test cases you’ve provided to make sure they don’t result in a crash. AFL wants clean test files that will cause the program to behave as expected so that it can begin iterating on them to trigger unusual behavior.
In contrast, crash exploration mode confirms that these test cases already result in a crash, since it’s going to try to identify other code paths that will result in the same state.
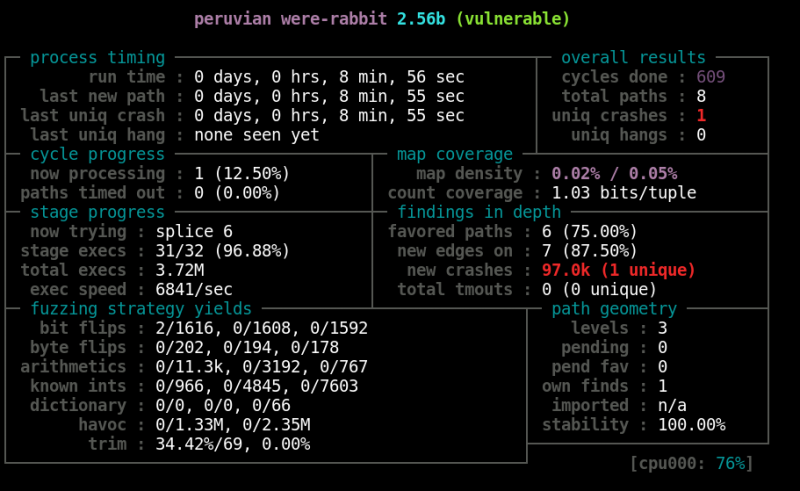
Once AFL has started, you should see something like this:

Note that the name displayed at the top is “peruvian were-rabbit”, which is the name used for the crash exploration mode. Also note the massive number of crashes — I have 97.0k after nearly nine minutes of fuzzing. However, the single unique crash is the one we’re interested in, since it’s an iteration on a previous one that has now triggered some new code path. Upon generating enough of these crashes, we could begin to compare the different crash iterations to see what’s changed. The crash exploration mode can be useful in determining which crashes will likely be most remunerative to study in greater detail.
rr (Record and Replay Framework)
This is a project that allows “recording” the execution of a program. You can then debug that recording, moving around to different points in time and examining the state of the program as you would in a regular debugging session. This is sometimes referred to as “time-travel” debugging or “timeless” debugging.
There are several advantages to this form of debugging, which you can read more about on the official rr project site (https://rr-project.org/). For the purposes of triaging fuzzer-generated crashes, one of the most significant advantages is the ability to more easily work backward from a crash to determine how the crash-generating input was used and what code paths were selected on the way to the crash.
Another perk of using rr is that crashes that occur due to non-determinism are easier to analyze, so long as you can at least reproduce the issue once while recording with rr. Ordinarily, if you’re debugging a crash and discover that you need to go back to an earlier point in time to check something, you’ll need to re-run the target program and try to cause the crash again. In the case of a non-deterministic bug, it might be tricky to coax the program into producing the same crash again. Because rr creates a recording of the program’s execution, you can quickly move back to an earlier point in time to perform your check, then jump back to where you left off. There’s no longer any need to re-run the program. The recording will always play out the same way every time.
One quirk of rr is that, when run in a virtual machine, it relies on some specific performance counter hardware virtualization that isn’t supported by every virtualization platform. I was able to run rr successfully through VMWare, but not through VirtualBox. Additionally, rr currently only supports Linux.
Once you’ve gotten rr installed on a supported virtualization platform, you’ll first want to allow rr to read specific performance events by setting the value of your perf_event_paranoid file to 1:
|
1 |
echo 1 > /proc/sys/kernel/perf_event_paranoid |
You can then record the execution of the program by using the “rr record” command before running your vulnerable program, as seen in the following screenshot:
![]()
You can now run the “rr replay” command to be dropped into a GDB session and begin examining the recorded execution. In the following screenshot, you can see that the replay has begun at the _start() function.
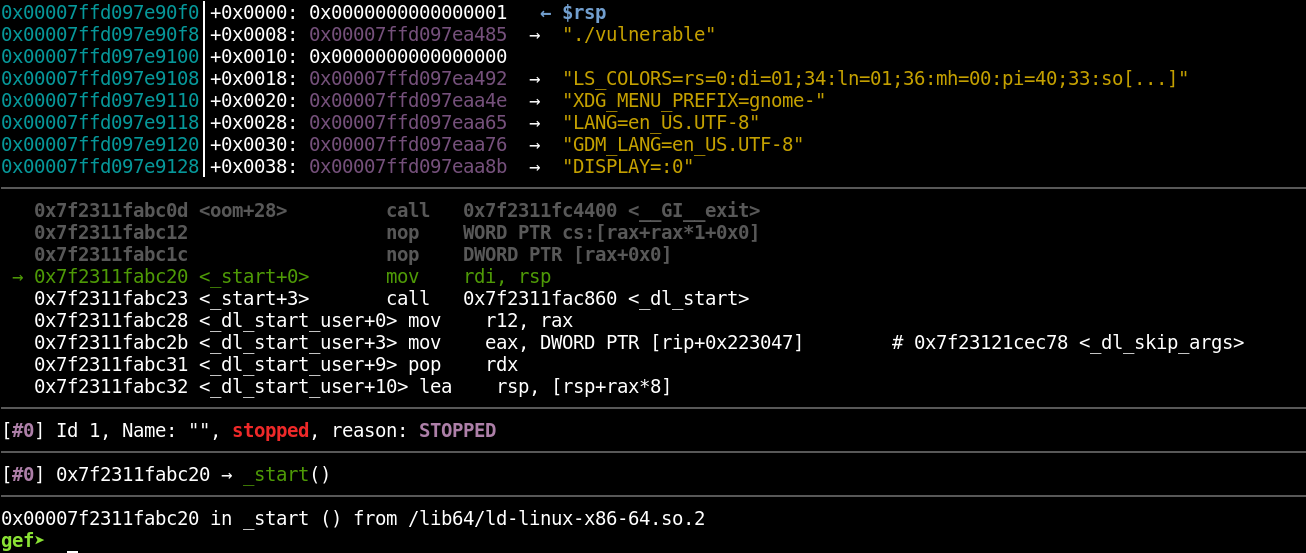
Also note that I still have access to the GEF plugin for GDB; rr is an enhancement for GDB, but doesn’t replace it. By typing “c” to continue (just like in a regular debugging session), you can continue to the point at which the binary crashed.
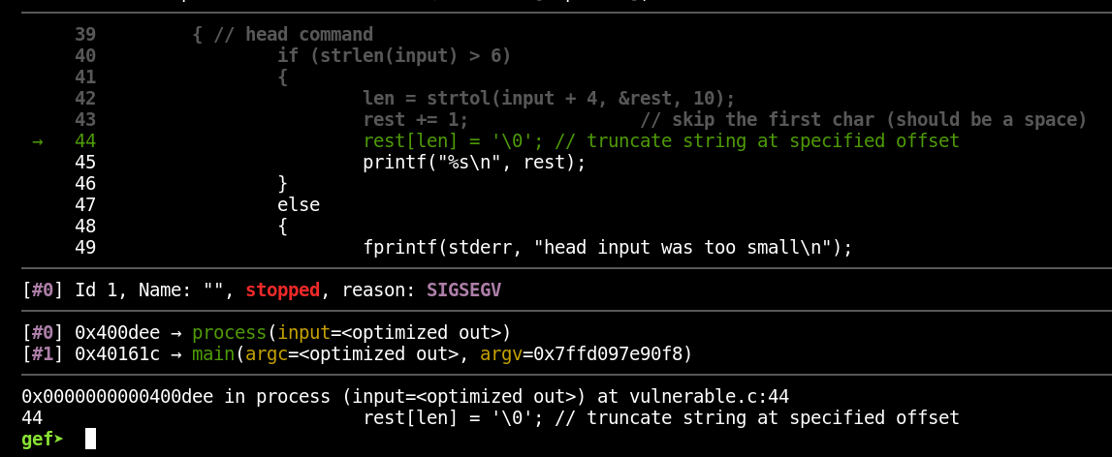
So far, we haven’t seen anything remarkable except the ability to work through the exact same program execution over and over. Let’s check out one of the star features of rr now. What if we wanted to know what the program’s state looked like just before the crash? Normally, we’d have to restart the entire binary and set a breakpoint on the preceding instruction in order to find out. With rr, we can make use of reverse execution to step backward in time. Let’s take note of the current instruction:

We’re currently on the instruction located at *process+702. Now, let’s go back a couple of instructions by using rr’s reverse-step functionality. Just run the command “reverse-step” several times (for some reason, I have to initially run any “reverse” command twice to start moving backward; I’m not sure why).

We’ve now time-traveled into the past! Notice that we’re several instructions back now, at *process+688. Our next step back would take us into the strtol() function, which we may not be interested in debugging. To step over it back to *process+680, we can use the “reverse-next” command.

We’ve skipped over the strtol() function, just as we would with a “next” instruction while performing normal debugging.
Watchpoints can be combined with rr to great effect. Let’s say we’re interested in knowing when the address 0x00007fffaf1c8220 has its content changed. We also want to know when that happened most recently before the crash. To find out, let’s first type “c” to continue execution forward again and arrive at the crash. Next, let’s configure a watchpoint on that address by running the following command:
|
1 |
watch * 0x00007fffaf1c8220 |

With that set, let’s now run the “reverse-continue” command to go back in time until the most recent write to that address (again, I have to run the command twice before I actually start moving backward):
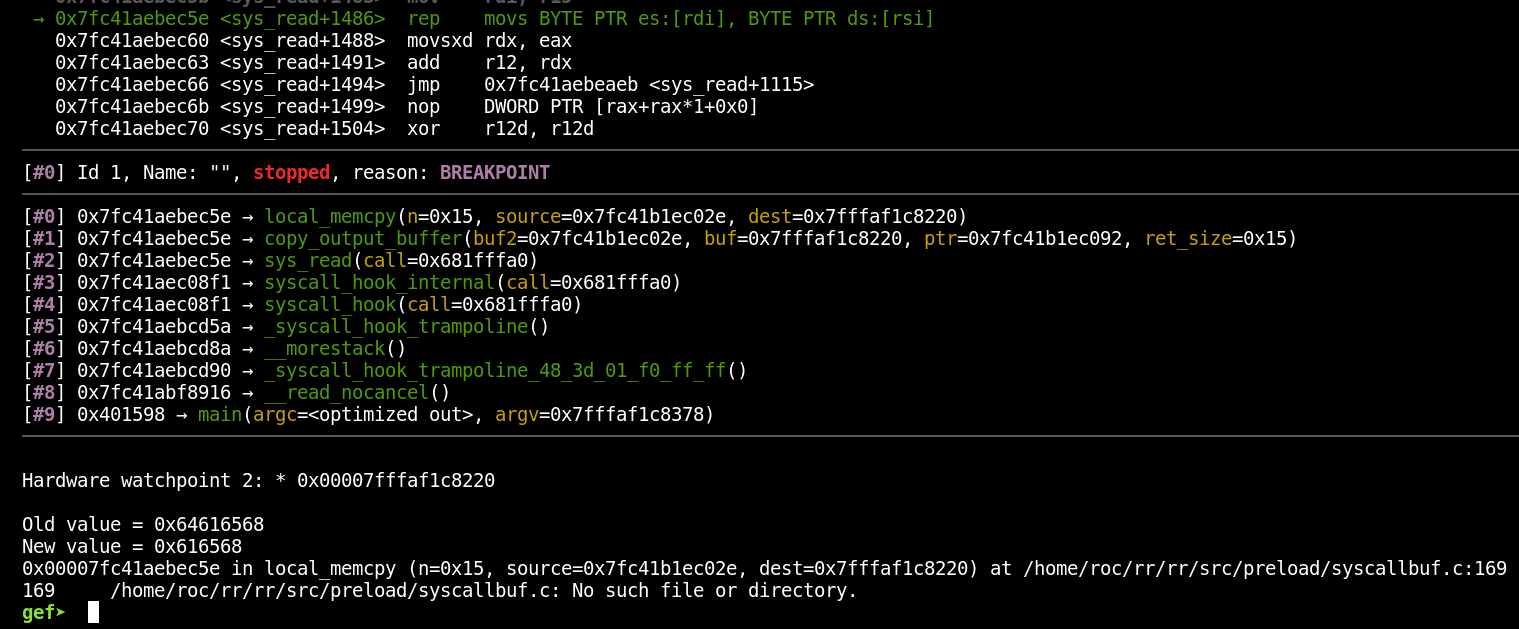
We can now see exactly when the address changed and what was written to it. Keep in mind that, since we’re going back in time, the “old value” is actually the value that address held most recently, and the “new value” is the value the address held before it got changed. Working backward to observe each change to an address could help track down a tricky bug such as a use-after-free (there’s a writeup about doing just that linked a couple of paragraphs down).
rr is a fantastic tool for performing detailed crash analysis. Careful debugging can be a slow process, however, so rr probably isn’t the very first tool you should reach for as you begin triaging fuzzer-generated crashes. Instead, you may want to narrow down the number of promising crashes by using some of the triage tools detailed earlier in this post. Once you’ve whittled your collection of crashes down to an approachable number, rr could help significantly cut down on the time spent debugging crashes to determine their security implications.
rr was especially designed to enable easier debugging of particularly complex software such as browsers. If you’re interested in seeing rr in action with a target that’s a little more complex than a contrived vulnerable binary, you may enjoy this excellent blog post from Ret2 Systems that describes leveraging rr to perform root-cause analysis of a bug in JSC:
https://blog.ret2.io/2018/06/19/pwn2own-2018-root-cause-analysis/
Recap
We covered several techniques and tools designed to make the crash triage process less tedious and time consuming.
- You can begin the triage process by just re-running the target binary in GDB (or another debugger) with the crash file as input. This helps you ensure that you can reproduce the crash and gives you a chance to quickly examine the basic crash details in a debugger.
- The exploitable plugin for GDB is a handy tool to use early in the triage process. It’ll examine the crash state of the application and assign it a classification that indicates the likelihood that the crash is exploitable (keep in mind that this doesn’t take into account the difficulty of working around any exploit mitigations in place).
- Crashwalk is a tool that pairs with exploitable to iterate over an entire list of AFL-generated crashes and run exploitable on all of them, storing the output in a crashwalk.db file. This saves you the tedium of individually opening every crash and running the plugin by hand. Crashwalk also performs additional sorting to make the results easier to parse.
- AFL features a crash exploration mode that will iterate on existing crashes by mutating the input in order to reach new code paths without changing the underlying crash. This is helpful for gaining a better understanding of how much control an attacker has over a faulting address or other crash condition, and can help you determine which crashes are most likely to be useful when writing an exploit.
- The rr project allows for recording the execution of a program and then replaying it during a debugging session. This makes it easy to “time-travel” through the execution, sparing you the annoyance of restarting a program over and over in an attempt to identify the state of the program at a very specific point in time.
Hopefully, this post has highlighted some useful starting points for performing triage on fuzzer-generated crashes.

